Home > Tides >
Tide Graphs Instructions
Instructions
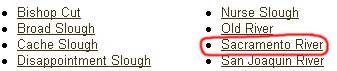
- Pick a waterway from the list at the list
![](images/1x10_spacer.gif)
![Waterways](images/tides_select_waterway.jpg)
![](images/1x10_spacer.gif)
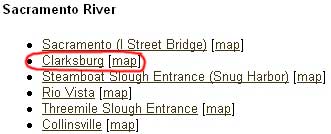
- Pick a specific site
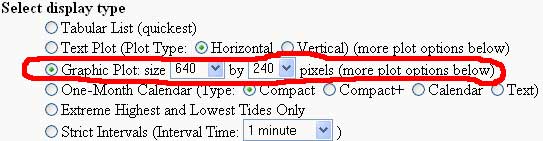
![](images/1x10_spacer.gif)
![Sites](images/tides_select_site.jpg)
![](images/1x10_spacer.gif)
- Select Graphic Plot
![](images/1x10_spacer.gif)
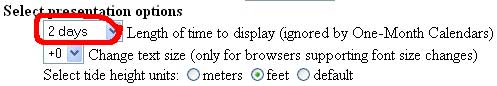
- Select the amount of days you want to plot (for example 2
days)
![Days](images/tides_select_presentation.jpg)
![](images/1x10_spacer.gif)
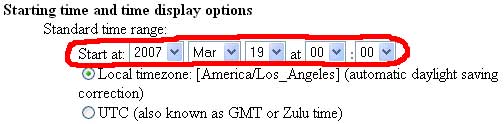
- Select a starting date (for example March 19, 2007)
![](images/1x10_spacer.gif)
![Time](images/tides_select_date.jpg)
![](images/1x10_spacer.gif)
- Select Make Prediction Using Options
![](images/1x10_spacer.gif)
![Make a Prediction Using Options](images/tides_make_prediction.jpg)
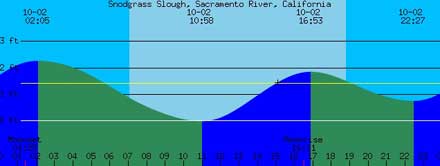
You will get a graph like this:
![Tide Graph](images/tide_graph.jpg)
|